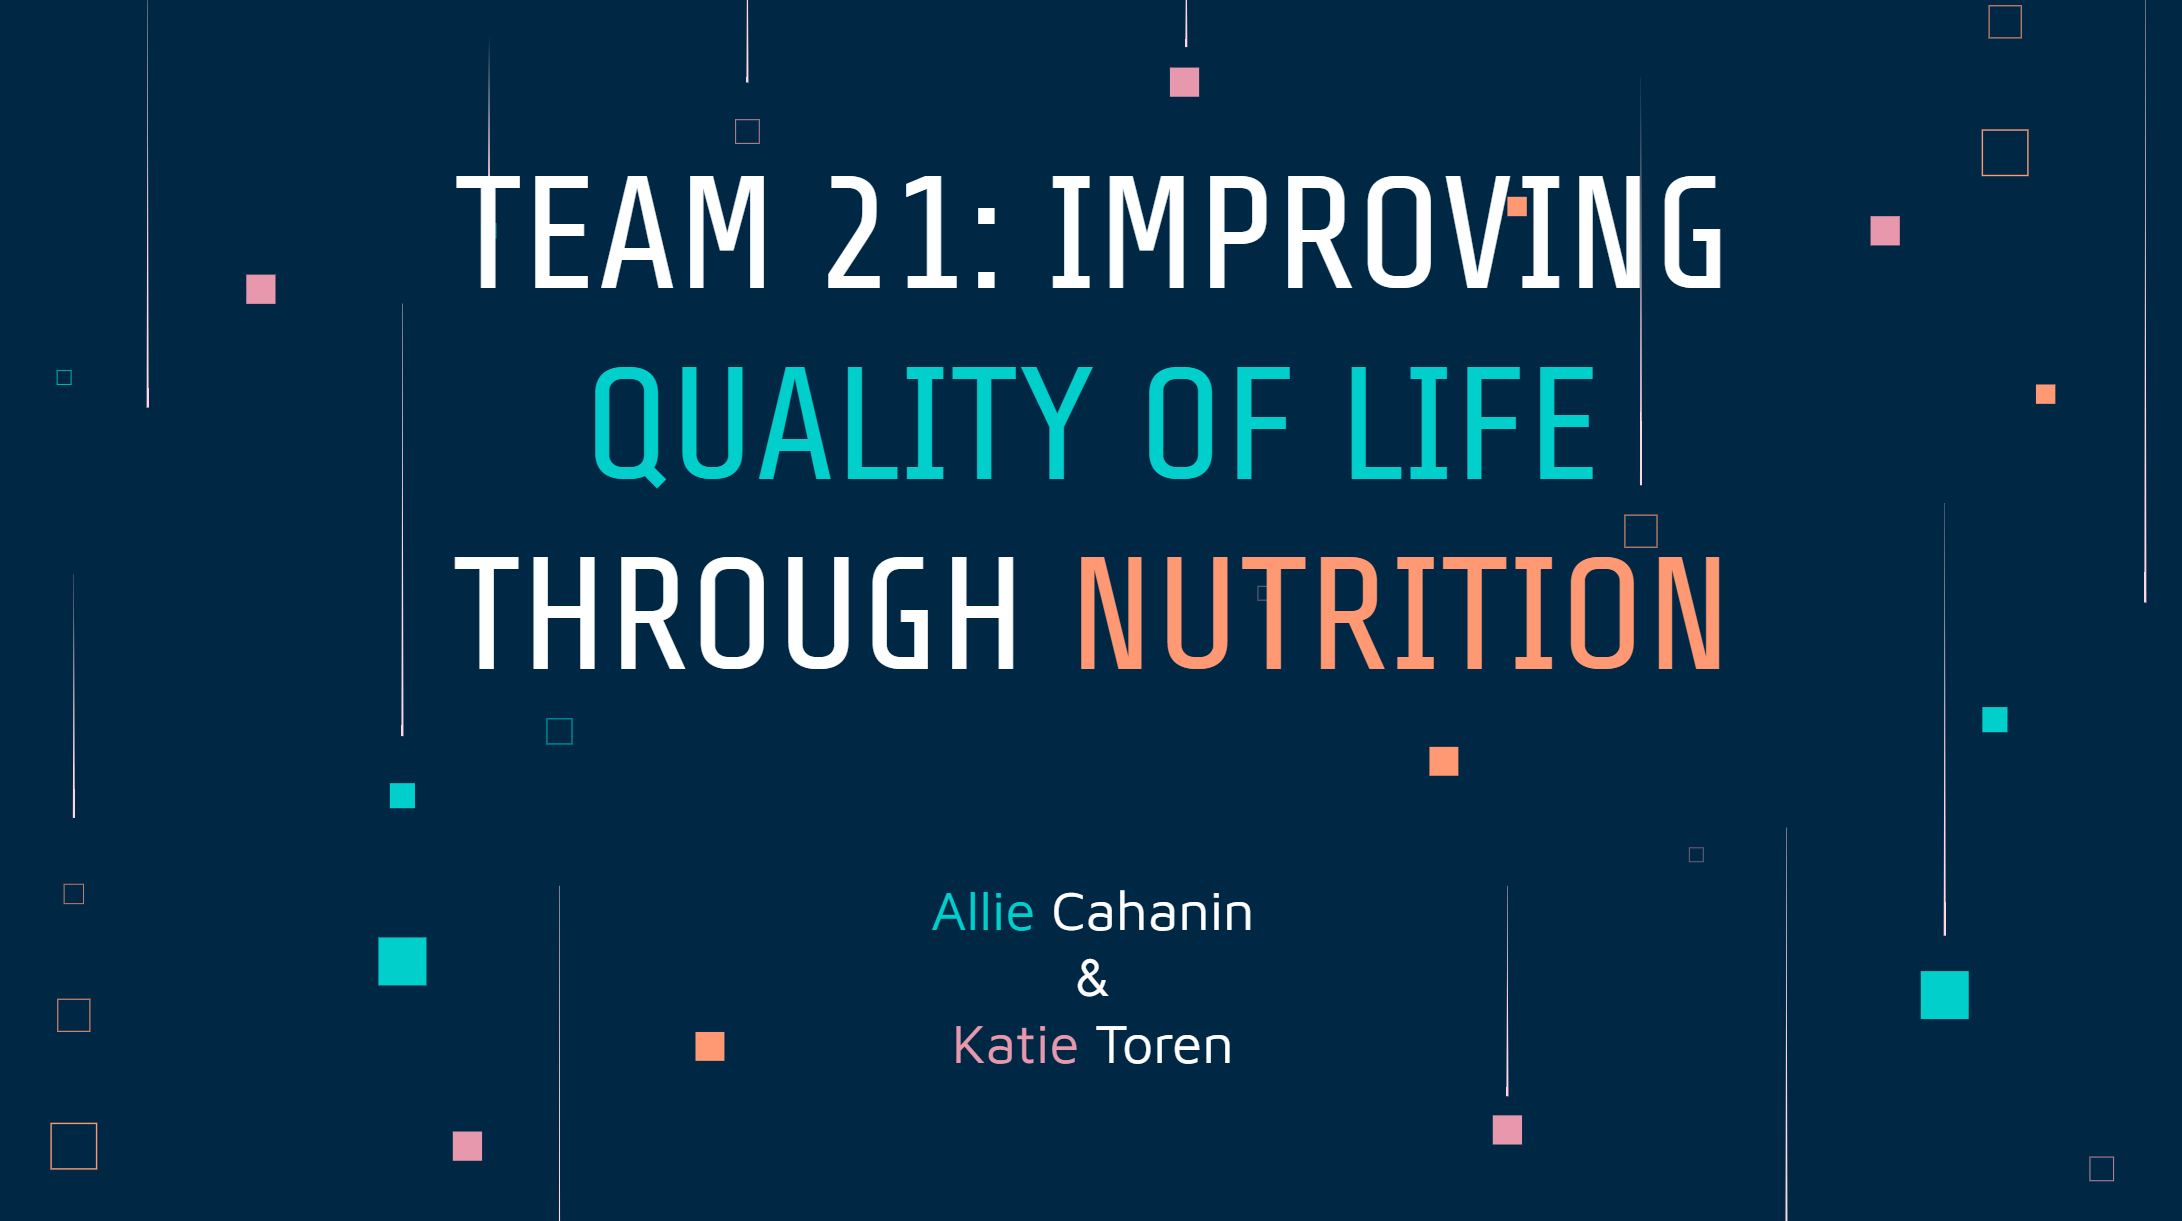
The UMD Data Challenge (https://datachallenge.ischool.umd.ed) is an annual, week-long data exploration event hosted by The UMD College of Information Studies, where participants gain analytical experience, build technical aptitude, and obtain team-building experience. Based on the project “ Improving Quality of Life through Nutrition”, MS GEOINT students Allie Cahanin and Katherine Toren won the Grand Prize: Best Overall Project. Big congratulations to Allie and Katie.
Here is an abstract of the project: In 2012, the World Health Organization defined a methodology known as the Quality of Life assessment to measure an individual’s perception of their position in life. One way in which QOL is heavily impacted is proper nutrition. As the UN states in its Sustainable Development Goals, the need to “achieve food security and improved nutrition and promote sustainable agriculture” is paramount. In the US, the USDA is also working, via partnerships, to support improved nutrition by publicly sharing data from its Food Composition Databases.
The goal of this project is to leverage a subset of data from the USDA database to glean insights and make suggestions about sourcing healthy ingredients, providing meal options in support of a balanced diet, and the cultivation of healthier and more sustainable living. This project seeks to discover the most commonly used ingredients in popular meals, combinations of ingredients appearing together commonly, and ingredient nutrition information in order to make the above-mentioned recommendations.
To accomplish these goals, this project will use R to parse, analyze and visualize data regarding packaged meals by combining files that include information about ingredients and nutritional values. Data cleaning will be intensive, involving: parsing and unnesting ingredients and nutrients and using regular expressions and formulas from various R packages. Performing primary component analysis (PCA) on both the nutrient values of and ingredients in packaged meals will reduce the dimensionality of the data sets and enable easier identification of which nutrients and which ingredients contribute the most to overall variance. UMAP visualization of these nutrients and ingredients allows an alternative view to potentially show variable clustering based on similarity. These similar and influential nutrients and ingredients can then be visualized to identify patterns within the overall branded food categories and support additional analyses, visualization, and ultimately the generation of recommendations.
You can find more about the their winning experience on the SESYNC blog here!


