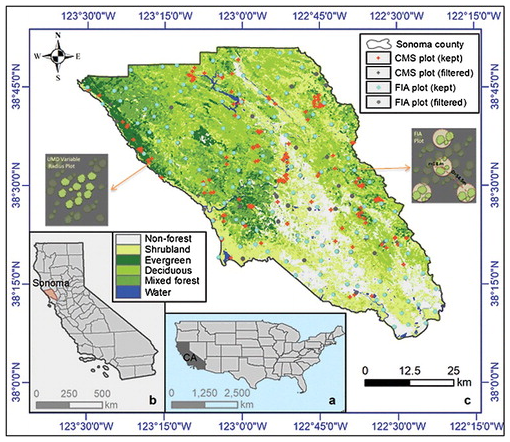
In a paper published in the journal Carbon Management, researcher Wenli Huang, along with UMD researchers Anu Swatantran, Laura Duncanson, Dana Watkinson, Katelyn Dolan, George Hurttand Ralph Dubayah, as well as Jarlath O'Neil-Dunne from the University of Vermont and Kristofer Johnson from the USDA Forest Service Northern Research Station present a framework for comparing multiple forest biomass maps at the county-scale in Sonoma, CA. The evaluation demonstrates that the biomass maps generated using LiDAR and auxiliary data achieved the most accurate estimates at the plot-level. The comparison confirmed that lacking that data tends to under-estimate the total biomass.
The abstract of the article is provided below:
The amount of carbon stored in forests affects a wide range of regional- to global-scale climate change processes. However, current maps often show large differences in carbon accounting. In this study, we present a framework to evaluate and compare multiple recent biomass maps at the county scale (4119 km2). We first compare the differences in the forest and non-forest areas at the pixel and county levels from multiple maps. Map-based estimates of county-level mean and total biomass are compared to the United States Forest Service (USFS) sample-based estimates. Comparison of raster-based biomass products shows differences in mean and total biomass at both pixel- and county-levels. Despite all the maps using USFS's plot data for model training, only the three active sensor derived products compare well to USFS's estimates of total biomass (within 10%), while the three passive sensor derived map products underestimated total biomass by as much as 47%. Our evaluation demonstrates that the biomass map generated using combined Light Detection and Ranging (LiDAR) and auxiliary data achieve accurate estimates at plot-level (R2 = 0.67; RMSE = 97.9 Mg.ha-1). This comparison study confirmed that missing direct height information either from active sensors tends to underestimate total biomass and mean biomass density at county-level.


